

The New Analytics tool in CarmenCanvas allows you to see students' aggregated weekly activity. You can sort activity by resource, which means you don't have to comb through individual student data records to find out what items are getting the most attention from students. You can see how students are engaging with your course by viewing data for specific course pages, files, assignments or other resources.
These learning analytics provide you with valuable and actionable information that can be used to help improve both teaching and learning. They help track student engagement, interactions, and behavior in ways that can inform your decisions about course structure and approaches, allowing timely and deliberate adjustments to improve student learning; making analytics especially useful when teaching a fully online course.
The continuous feedback received through analytics also helps students self-reflect on their own learning processes. Analytics can help you to identify and support students who may be struggling and allows you to easily message these students from within the New Analytics tool (see Communicate with Students below).
Information about New Analytics:
- Data is for viewing only and cannot be changed
- Data is updated every 24 hours; any updates you make to grades today won't be reflected until tomorrow
- Only instructors in the course can view course analytics
- Page views and participation metrics include an aggregate across all devices, including Canvas mobile apps
For an overview of Course Analytics, see the Canvas Basics video What is Course Analytics?.
Access course analytics
There are two ways to access New Analytics in your course:
- From the course homepage
- From the global navigation (must be enabled)
To access from the course homepage:
- Log in to carmen.osu.edu
- Navigate to the desired course
Click on New Analytics from the right-hand options
Image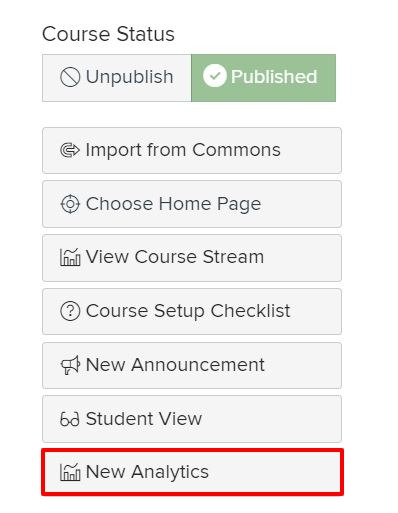
To access from the course navigation:
New Analytics can be accessed from the Course Navigation. By default, this link is hidden in Course Navigation in each course and must be enabled.
- Log in to carmen.osu.edu
- Navigate to the desired course
- Click on Settings from the left-hand course navigation menu
- Click on the Navigation tab
- Scroll to the New Analytics link
- Drag the New Analytics link to the enabled section
- Click Save
The New Analytics link will now appear in your course navigation. Students will not see the New Analytics link.
View student activity
A quick way to view how students are participating in your course is to view the Weekly Online Activity chart. The weekly online activity is comprised of page views and participation.
To view weekly online activity:
- Navigate to the desired course
- Click on New Analytics from the course home page (or course navigation, if enabled)
New Analytics defaults to the Course Grade view, click Weekly Online Activity
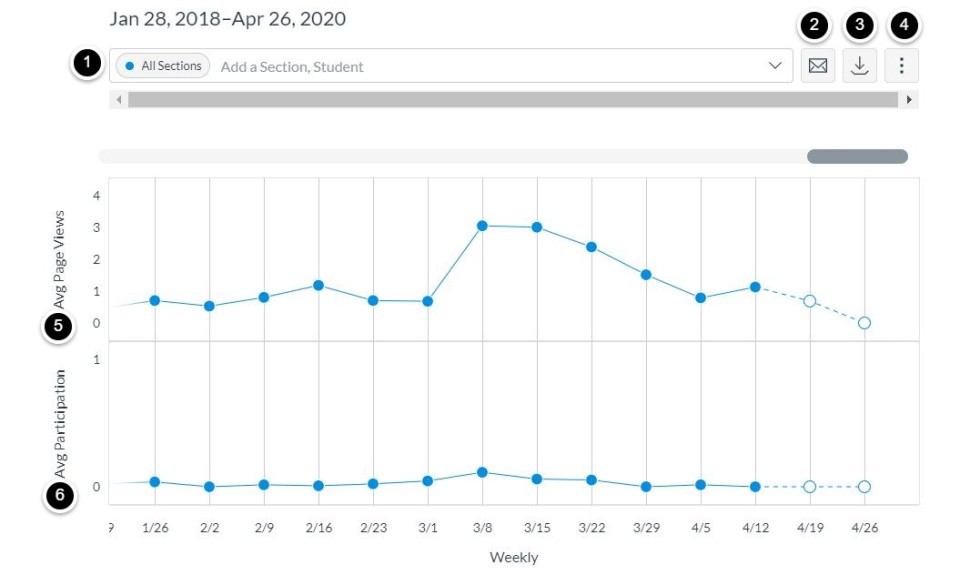
The analytics page is dynamic based on filtered content. By default, all sections are displayed [1] and cannot be removed. You can message students [2], download a CSV of the data [3], and change the chart view [4].
Filtered data is displayed as a chart with two rows: average page views [5] and average participation [6]. The following actions will generate participation data:- Announcements: posts a new comment to an announcement
- Assignments: submits an assignment
- Collaborations: loads a collaboration to view/edit a document
- Conferences: joins a web conference
- Discussions: posts a new comment to a discussion
- Pages: creates a page
- Quizzes:
- submits a quiz
- starts taking a quiz
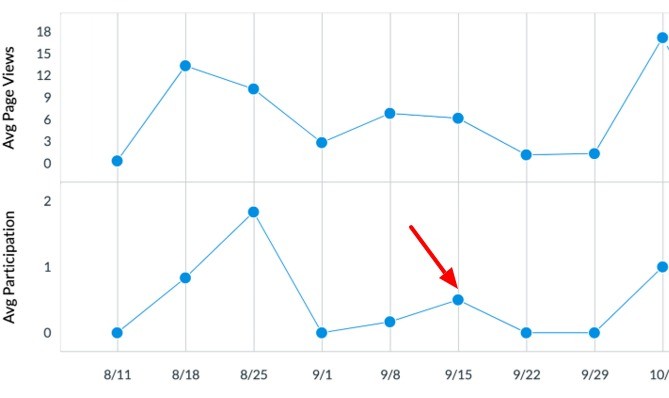
To view more information, click a data point in the graph. This opens the data tray.
In the data tray, you can view expanded details for the data point, including:
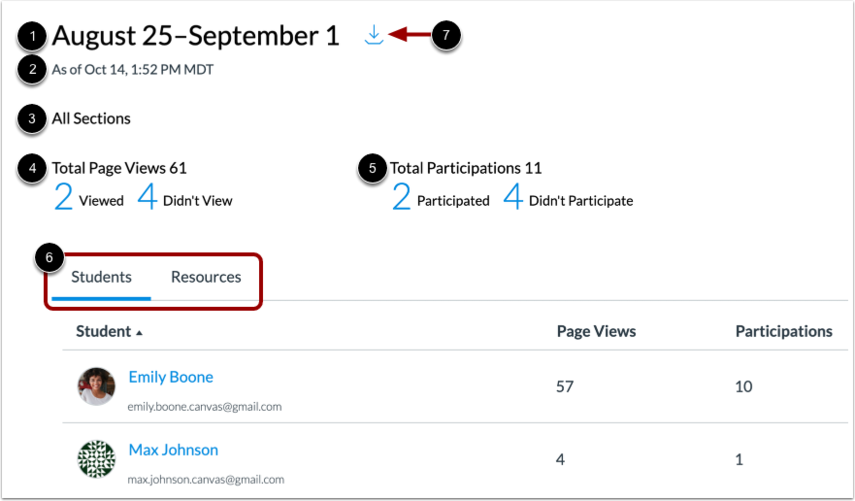
- the date range
- the last time analytics were updated
- the current filter view
- total page views
- total participation
- the student and resources tables
- Download CSV link to download data
Additionally, you can view course grade and participation analytics for an individual student.
Communicate with students
Using New Analytics, you can create a filter for a specific grade or assignment participation criteria and send a message to students who meet that criteria. You can message students whose grades or submissions are among three specific criteria:
- grades are within a specific percentage range
- missing assignments
- late assignments
To message students:
- Open New Analytics in the desired course.
If you want to filter analytics for a specific assignment, section, or student, search for and select the intended filter in the Filter field.
Image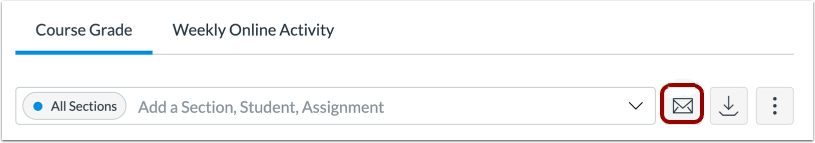
Then click the Message icon to open a Message Students Who window.
For more detailed information on how to message students within New Analytics see:
Canvas guides
For additional information on New Analytics see the following Canvas guides:
- How do I send a message to all students based on specific course criteria in New Analytics?
- How do I send a message to an individual student in New Analytics?
- How do I compare the course average chart graph with an assignment, section, or student filter in New Analytics?
- How do I view average course grade analytics in an interactive chart graph in New Analytics?
- How do I compare the course average data table with an assignment, section, or student filter in New Analytics?
- How do I view average course grade analytics in a data table in New Analytics?
- How do I view weekly online activity analytics in an interactive chart graph in New Analytics?
- How do I view weekly online activity analytics in a data table in New Analytics?
- How do I compare the weekly online activity chart graph with a section or student filter in New Analytics?
- How do I compare the weekly online activity data table with a section or student filter in New Analytics?
- How do I view analytics for an individual student in New Analytics?