


Assessment Scenario: In Design 4200, students complete a co-design research project for which they plan, execute, analyze and present their research as a team. Learn how the instructor evolved this research assignment to place equal importance on the process and final product by requiring detailed project documentation on a virtual whiteboard—including explanations of how students used AI to complete research tasks.
Instructor: Liz Sanders
Department: Design
Course: Design 4200: Design Research Two
Contact: sanders.82@osu.edu
Course Details
Format: In-person
Typical Enrollment: 25 to 30 students per section, with two sections offered during Fall Semester
Instructional Staffing: One primary instructor and one graduate-level GTA
Learning Context: Hands-on, team-based in a studio environment. Students are third year undergraduates in the Design Major. The course is required for all undergraduate Design majors (Industrial Design, Visual Communication Design and Interior Space Design). Students from the three majors are mixed into two sections of the course. Students have taken prerequisite research methods course so they already have some basic research methods skills.
Expected Learning Outcomes
- Conduct and analyze generative design research from a participatory perspective in order to produce ideas, insights and concepts that may then be designed and developed
- Explore the use of new communication technologies in generative design research
Opportunity
Emphasizing the process as well as the outcome
In D4200 students learn how to conduct research for the design and development of products, services, spaces and communications with a focus on the fuzzy front end of design. Having worked with a traditional approach in a prior required course, this course addresses design research from a participatory mindset: designing with people.
One major way in which the learning outcomes are achieved is that student teams plan, execute, analyze and prepare a presentation about a co-design research project on a topic of their choice. The final presentation that they give to the whole class offers a 20-minute high-level overview of their research project.
After the widespread availability of generative AI chatbots, I became concerned that my students might be over-relying upon AI to complete their work. As a result, I place equal emphasis on the outcome and the process of team-based projects, which helps my students become more aware of how and when their process is supporting their work. It also shows me exactly what they did on their project.
Change
Making the process transparent with detailed documentation
I have experimented with allowing my students to use AI in their projects. In addition to their final presentation, I require that they provide detailed descriptions in their project documentation that show all their work including the ways they used AI if they chose to do so.
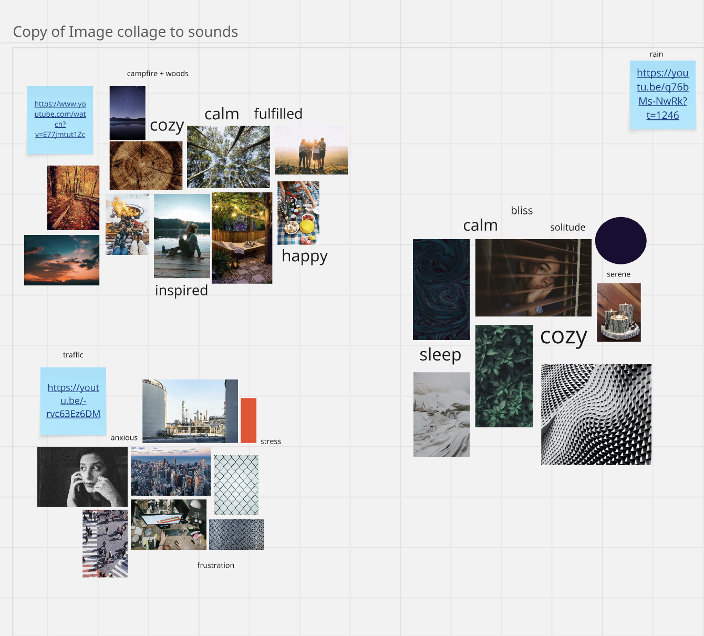
The documentation is to be turned in on a virtual whiteboard with links to other forms of documentation (e.g., Word, Excel, etc.) as needed. The documentation must include everything they discussed and all the activities that they engaged in. The documentation must be so well organized that someone unfamiliar with the project can review the material and understand what was done, when it was done, and how the results relate to the objectives, methods and data that emerged. A well-documented project will contain all the required components that are listed on the assignment sheet/rubric and it will contain navigational features (spatial layout, headers, “containers”, arrows, and so on) that make it easy for someone who is new to the project to understand what was done, when it was done and how it was done for every step of the process.
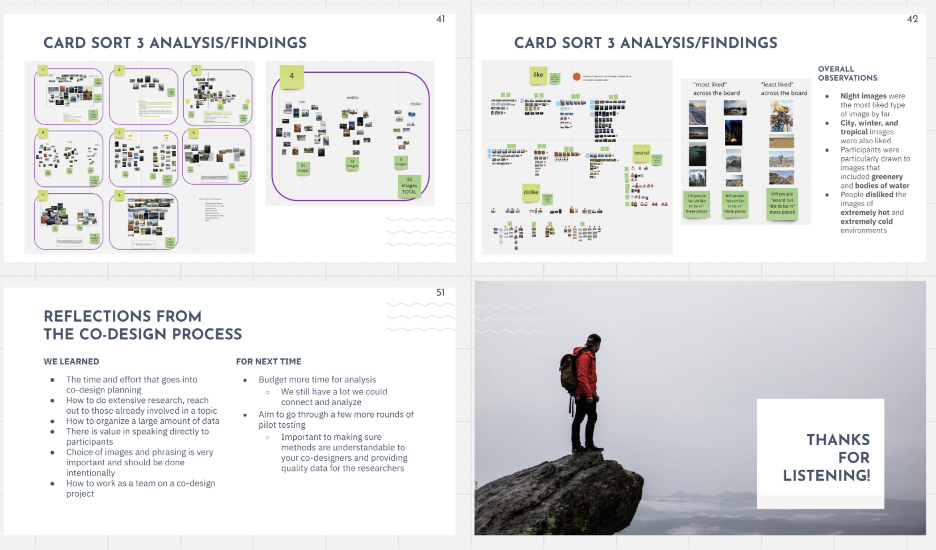
Because my students are studying design, the design and navigability of their virtual whiteboard documentation is usually very good. Projects that are less well-documented tend to be incomplete and/or not well organized. Here are some screen shots of small portions of a team’s project documentation. The first shows analysis of raw data and the second shows a few of the ending slides in their final presentation. The entire board was too large to capture in a screen shot.
The virtual whiteboard reveals all the work done by the team but does not always identify who did what. The students are also required to evaluate each member of their team on their performance, contributions and attitude after the final project presentation. The peer evaluation scores and comments are summarized and used to modify the team score as appropriate. The peer evaluations contribute 10% to the overall grade so it is possible to reward the best students with a higher grade and to reduce the grades of any students who did not contribute well to the teamwork.
Next Steps
Understanding pros and cons of AI vs. human data analysis
This fall semester I added an assignment that had the D4200 students make their personal learning journeys from a toolkit of visual and verbal components. They presented their journeys to the others on their team. Each team then analyzed the resulting data of the whole team. Half of them used AI to analyze the data and the other half analyzed the data “by hand”. Then they compared the two methods of analysis to discover the advantages and disadvantages of each method. From their presentations it is clear that they now have a very good understanding of how they can now combine the best of both approaches for analysis of design research data.